

凡例は、legendで描画しますが、2通りのやり方があります。
- 方法1:各グラフの描画時に凡例のラベルを指定する方法
- 方法2:凡例の描画時に、まとめてラベルを指定する方法
%matplotlib inline
import matplotlib.pyplot as plt
plt.style.use('seaborn-darkgrid')
# 方法1
fig, ax = plt.subplots()
ax.plot([2, 1, 3], label='sample 1') ここでラベル名を設定
ax.plot([1, 3, 2], label='sample 2')
ax.legend();
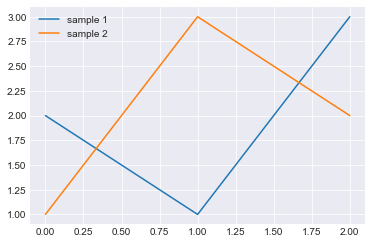
# 方法2
fig, ax = plt.subplots()
ax.plot([2, 1, 3])
ax.plot([1, 3, 2])
ax.legend(['sample 1', 'sample 2']); 最後にまとめて

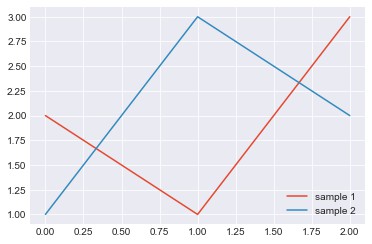
凡例の位置
凡例の位置は、locオプションをで指定できます。
fig, ax = plt.subplots()
ax.plot([2, 1, 3], label=’sample 1′)
ax.plot([1, 3, 2], label=’sample 2′)
ax.legend(loc=’lower right’);
グラフが2つだった場合
%matplotlib inline
import matplotlib.pyplot as plt
plt.style.use('seaborn-darkgrid')
fig, axes=plt.subplots(2)
axes[0].plot([2, 1, 3], label='Item 1')
axes[0].set_title('Subplot 1')
axes[0].legend(); レジェンドは一つ一つ設定する
axes[1].plot([1, 3, 2], label='Item 2')
axes[1].set_title('Subplot 2')
axes[1].legend();
fig.tight_layout() レイアウトは一つでよい(fig)にする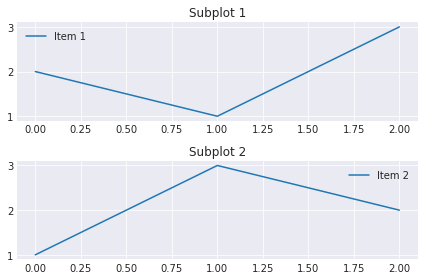

コメント