- データの読み込み
- データのプロット
- 説明変数(X)と目的変数(y)の取得
- トレーニング・テスト用にデータを分割
- モデル作成とトレーニングデータの学習
- テストデータでスコア算出
- 学習した領域のプロット
%matplotlib inline
import numpy as np
import pandas as pd
import matplotlib.pyplot as plt
from matplotlib.colors import ListedColormap

def arange2(a, num):
    """numpy.ndarrayを最小と最大の間でnum+1分割する"""
    amin, amax = a.min(), a.max()
    return np.arange(amin, amax + 1e-8, (amax - amin) / num)


def plot_tree(clf, X, y, num=50, colors=('red', 'blue')):
    """
    X.iloc[:, 0]とX.iloc[:, 1]の2次元で、yの0-1ラベルによる散布図と
    予測(clf.predict)の等高線(contourf)を描画
    """
    X, y = X.to_numpy(), y.to_numpy()
    xx0, xx1 = np.meshgrid(arange2(X[:, 0], num), arange2(X[:, 1], num))
    Z = clf.predict(np.array([xx0.ravel(), xx1.ravel()]).T).reshape(xx0.shape)
    plt.contourf(xx0, xx1, Z, alpha=0.4, cmap=ListedColormap(colors))
    for i in range(2):
        plt.scatter(X[y == i, 0], X[y == i, 1], alpha=0.8, c=colors[i])
    plt.show()
# 1. データの読み込み
df = pd.read_csv('./input/data13.csv')
df.head(3)# 2. データのプロット
plt.scatter(df[df['y'] == 0]['x0'], df[df['y'] == 0]['x1']) # 青
plt.scatter(df[df['y'] == 1]['x0'], df[df['y'] == 1]['x1']); # オレンジ
# 3. 説明変数(X)と目的変数(y)の取得
X = df.iloc[:, :-1]
y = df.iloc[:, -1]
from sklearn.model_selection import train_test_split
# 4. トレーニング・テスト用にデータを分割
(X_train, X_test,
y_train, y_test) = train_test_split(
X, y, test_size=0.3, random_state=0
)from sklearn.tree import DecisionTreeClassifier
# 5. モデル作成とトレーニングデータの学習
tree = DecisionTreeClassifier(random_state=0)
tree.fit(X_train, y_train)DecisionTreeClassifier(ccp_alpha=0.0, class_weight=None, criterion='gini',
max_depth=None, max_features=None, max_leaf_nodes=None,
min_impurity_decrease=0.0, min_impurity_split=None,
min_samples_leaf=1, min_samples_split=2,
min_weight_fraction_leaf=0.0, presort='deprecated',
random_state=0, splitter='best')# 6. テストデータでスコア算出
tree.score(X_test, y_test)0.8518518518518519# 7. 学習した領域のプロット
plot_tree(tree, X, y)
決定木解析の解説
決定木を使うにはscikit-learnの DecisionTreeClassifier を使います。
from sklearn.tree import DecisionTreeClassifier
tree = DecisionTreeClassifier()
tree.fit(X, y)
LogisticRegression と同様に .fit(X, y) メソッドを使って、データを学習します。
scikit-learnの分類器は全て同じようにメソッドを持っているので、新しい分類器も簡単に使い始められます。
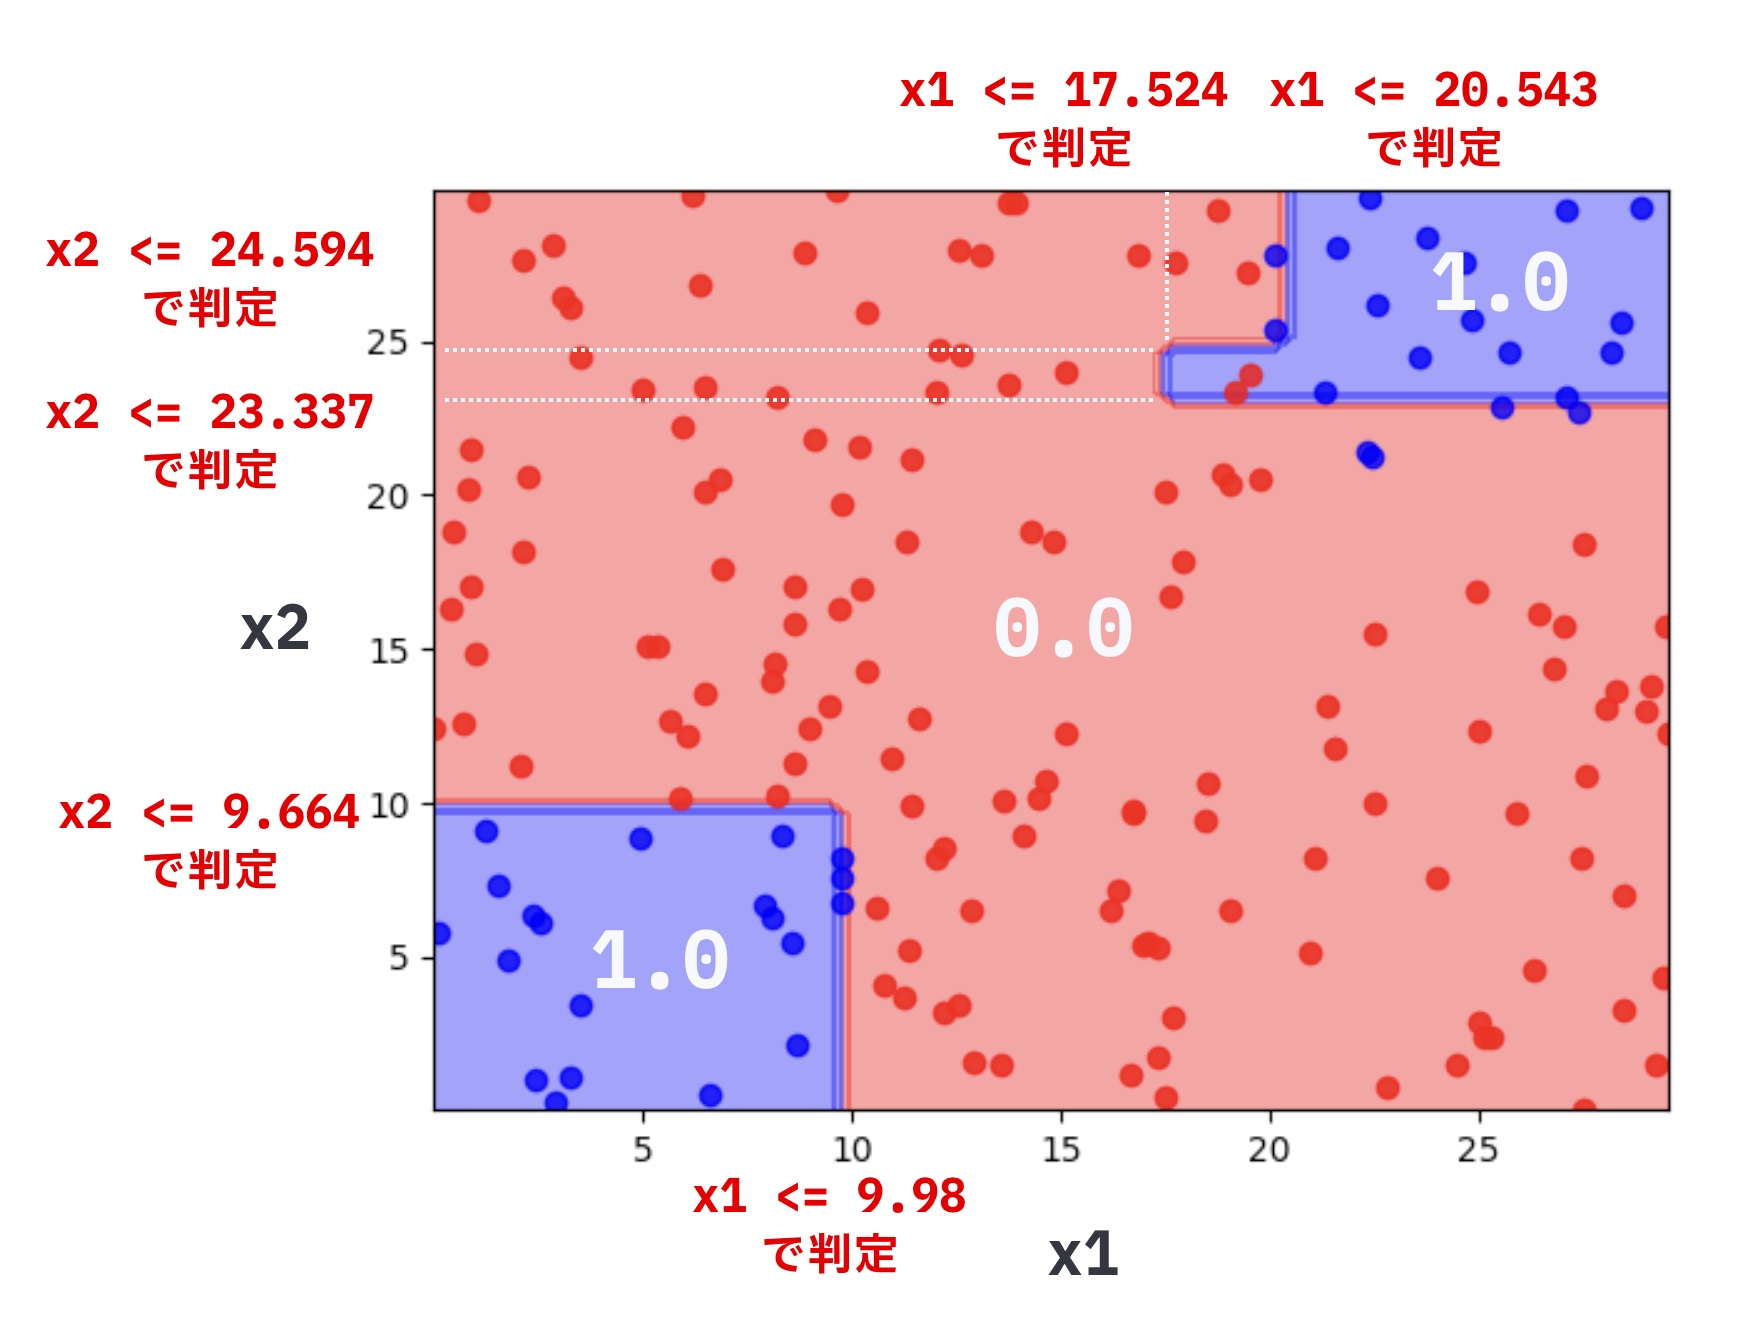
分類される領域
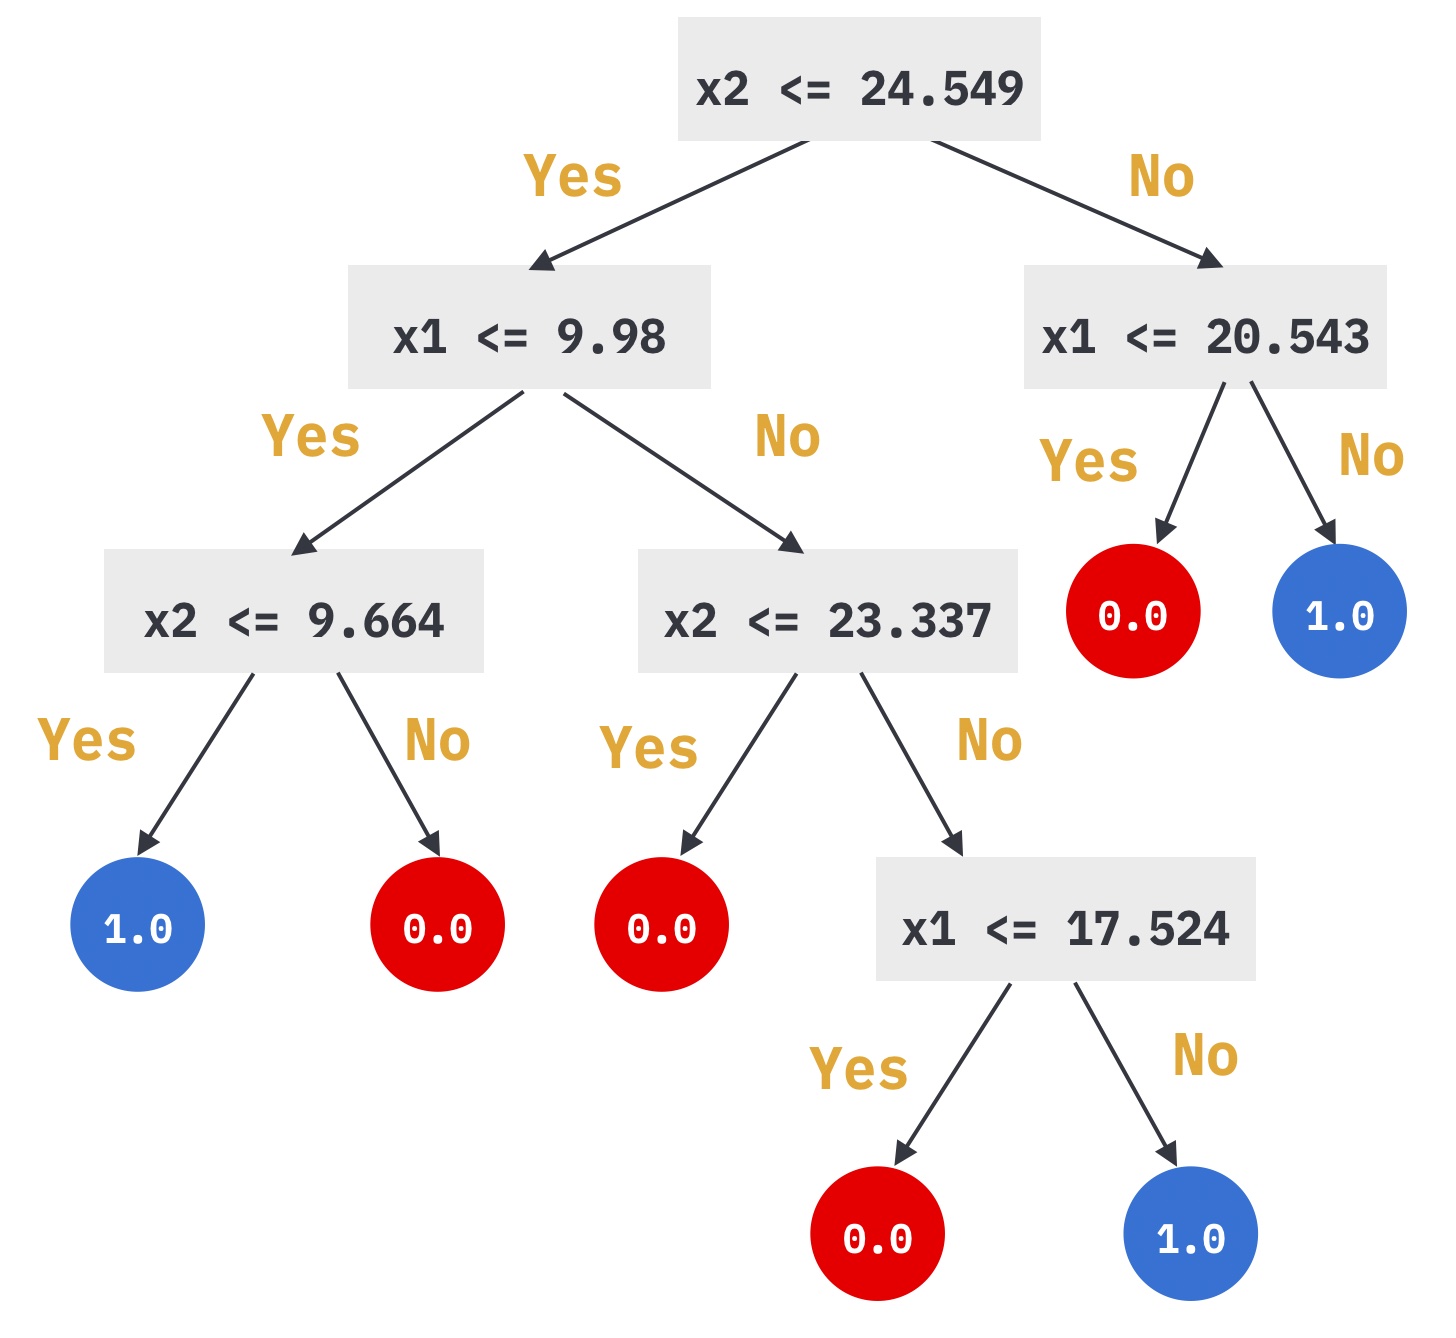
パラメータによって学習結果が変わるため、ここでは説明の都合上、モデルを下記のように実行した場合について説明します。なお、max_depth(決定木の最大の深さ)については、クエスト「過学習の罠について知ろう」で説明します。
tree = DecisionTreeClassifier(max_depth=3)
プロットされた領域を見ると、決定木の特徴が見てとれます。
決定木は軸に水平、垂直の場合のみ分類できます。

学習した決定木の判定条件をあらわすと以下のようになります。

if文のプログラムで、分類をしていたときを思い出してください。
このようなif文では軸に対して平行な分類しかできませんでした。
if weight > 60 and height < 170:
    ...
決定木も同じで、特徴の大きさ比較を続けることによって分類しています。
決定木の結果を図でみやすいように、plot_treeを用意しました。
plot_tree(tree, X, y)と実行すると、X.iloc[:, 0]とX.iloc[:, 1]の2次元で、yの0-1ラベルによる散布図と予測(clf.predict)の等高線を描画します。
なお、arange2は、plot_treeで利用している補助の関数です。
def arange2(a, num):
    """numpy.ndarrayを最小と最大の間でnum+1分割する"""
    amin, amax = a.min(), a.max()
    return np.arange(amin, amax + 1e-8, (amax - amin) / num)


def plot_tree(clf, X, y, num=50, colors=('red', 'blue')):
    """
    X.iloc[:, 0]とX.iloc[:, 1]の2次元で、yの0-1ラベルによる散布図と
    予測(clf.predict)の等高線(contourf)を描画
    """
    X, y = X.to_numpy(), y.to_numpy()
    xx0, xx1 = np.meshgrid(arange2(X[:, 0], num), arange2(X[:, 1], num))
    Z = clf.predict(np.array([xx0.ravel(), xx1.ravel()]).T).reshape(xx0.shape)
    plt.contourf(xx0, xx1, Z, alpha=0.4, cmap=ListedColormap(colors))
    for i in range(2):
        plt.scatter(X[y == i, 0], X[y == i, 1], alpha=0.8, c=colors[i])
    plt.show()


コメント